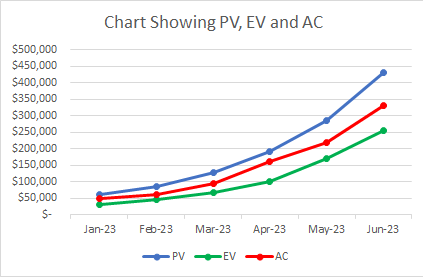
In the world of project management, staying on top of project performance is a constant challenge. Fortunately, Earned Value Management (EVM) offers a structured approach to measure and monitor projects in terms of cost and schedule. In this blog post, we will delve into the common earned value statistics, providing you with a clear and practical understanding of how to introduce and utilize this valuable technique in your projects.
Often the challenge is with calculating Earned Value (EV). Check out our article on
Understanding Earned Value
At its core, Earned Value focuses on comparing the value of work performed to the value of work planned at a specific point in time. By doing so, it helps project managers answer two critical questions:
- How much work have we accomplished as per the original plan?
- Are we ahead of or behind schedule, and are we using our budget effectively?
Common Statistics
- Planned Value (PV):
Also known as Budgeted Cost of Work Scheduled (BCWS), PV represents the estimated value of the work scheduled to be completed by a given date. It serves as a benchmark against which actual progress is measured. Example: If you planned to complete 50% of a $100,000 project by the end of the month, the PV for that month would be $50,000. - Earned Value (EV):
Referred to as Budgeted Cost of Work Performed (BCWP), EV signifies the value of the work that has been completed and verified by stakeholders up to a specific date. Example: Of a $100,000 project, if you’ve actually completed 40% of the work, then your EV would be $40,000. - Actual Cost (AC):
This represents the actual cost incurred to complete the work up to the same point in time as the EV. Example: If you’ve spent $45,000 on the project up to that date, your AC would be $45,000. - Cost Performance Index (CPI):
CPI measures the cost efficiency of the project. It’s calculated by dividing EV by AC. A CPI greater than 1 indicates favorable performance. Example: CPI = EV / AC = $40,000 / $45,000 = 0.8889. A CPI less than 1 suggests you’re over budget. - Schedule Performance Index (SPI):
SPI measures the schedule efficiency. It’s calculated by dividing EV by PV. An SPI greater than 1 implies you’re ahead of schedule. Example: SPI = EV / PV = $40,000 / $50,000 = 0.8. An SPI less than 1 indicates you’re behind schedule.
Using Earned Value in Practice:
- Calculating Earned Value:
Determine the percentage of work completed and multiply it by the total budgeted cost. - Interpreting CPI and SPI:
CPI and SPI values provide insights into project health. Values above 1 are positive indicators, while values below 1 signal potential problems. - Taking Action:
For instance, a CPI below 1 could mean cost overruns. You might need to reevaluate budget estimates or seek ways to cut costs. Similarly, an SPI below 1 could require adjustments to the schedule or increased resources.
Earned Value statistics offer an invaluable lens into project performance. By grasping the essentials of Earned Value Management and comprehending the significance of common statistics like PV, EV, AC, CPI, and SPI, you are better equipped to steer your projects towards success. Integrating earned value into your project management toolkit can significantly enhance your ability to make informed decisions, take corrective actions, and ultimately achieve project goals. Whether you’re an experienced project manager or just starting, embracing earned value can make a world of difference.
The above are simple explanations of Earned Value statistics. When you need to win over stakeholders without over quantifying, check out these tips in this external featured article Complicate the Project: When Simple Math Will Do! You will need to login or create an account with projectmanagement.com
